Physical Security KPIs: What to Track in 2026
Learn which physical security KPIs to track in 2026, how to structure reports for executives, and which pitfalls undermine even well-designed programs.
Physical Security KPIs: What to Track in 2026 and How to Report
Physical security programs generate data from access control logs, alarm records, camera feeds, and patrol activity. KPIs help security directors and facilities managers evaluate whether programs are reducing risk, staying within budget, and supporting compliance.
This guide covers the KPI categories that matter for enterprise physical security in 2026 and the reporting structures that turn operational data into decisions.
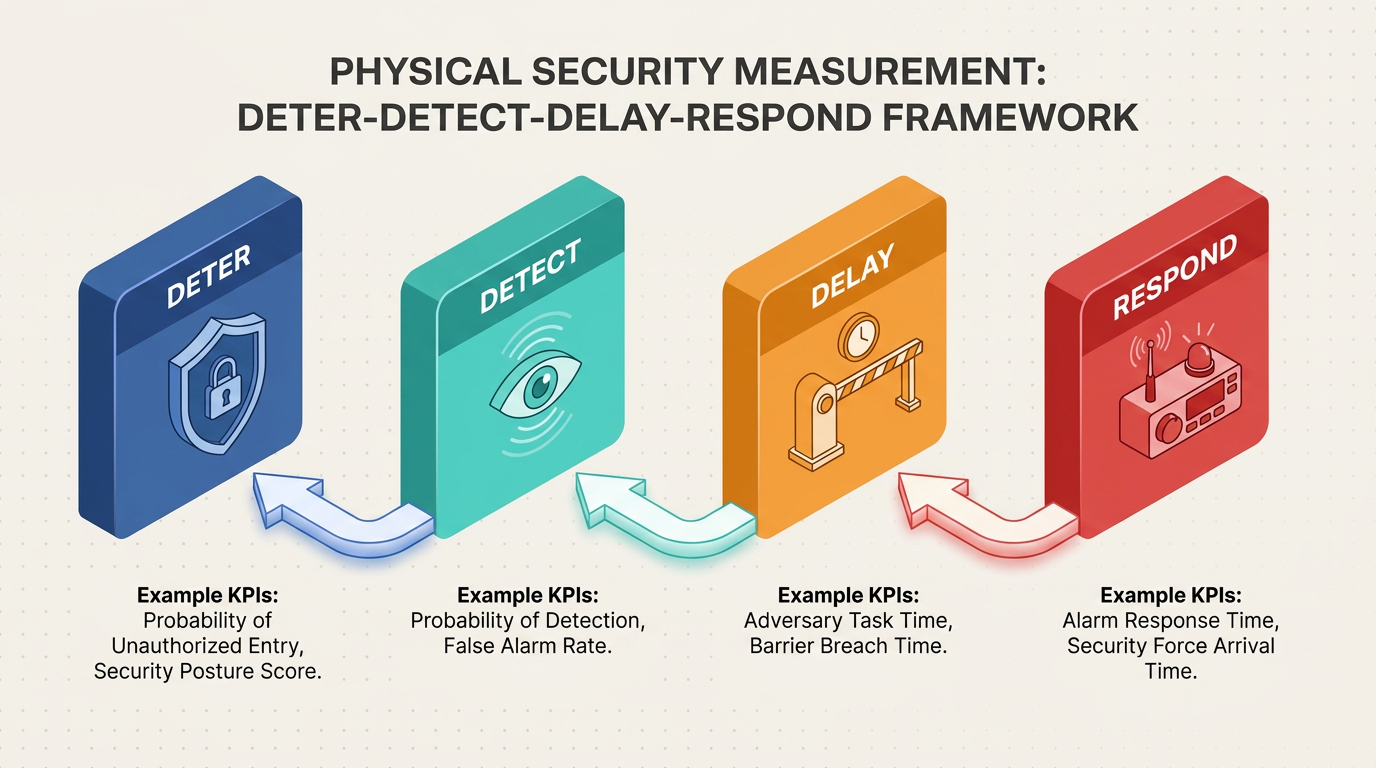
The Deter-Detect-Delay-Respond Framework
A useful model for physical security measurement maps performance to deter, detect, delay, and respond functions. Practical measures within that model include probability of detection, alarm communication and assessment time, nuisance alarm frequency, and response force effectiveness.
Probability of detection is a useful performance measure, but it cannot be derived from operational logs alone. Teams need adversarial testing, such as covert entry exercises and physical penetration assessments, to validate whether a protection system actually detects intrusion attempts under realistic conditions.
A useful architectural distinction separates KPIs from KRIs (key risk indicators). KPIs measure performance against objectives, while KRIs provide early signals about changing risk exposure and the direction a designated risk may be headed. Controls can be used with a corresponding performance scale that in turn supports key risk indicators. Both categories are necessary. The taxonomy below focuses on KPIs.
Operational KPIs
Every security shift generates timestamps, alarm logs, and incident records. The KPIs below convert that raw output into performance signals across detection speed, response effectiveness, and documentation quality.
Incident Response Time
Elapsed time from incident detection or report to first responder arrival or acknowledgment. Measurement starts at the alarm trigger or incident report creation timestamp and ends at first responder acknowledgment. Segmenting by severity tier prevents aggregate averages from obscuring slow response to higher-consequence events. Internal historical baselines are the primary benchmarking mechanism.
Mean Time to Acknowledge and Mean Time to Resolve
MTTA (mean time to acknowledge) isolates the interval between alarm trigger and operator acknowledgment in the security operations center. MTTR (mean time to resolve) captures the full interval from incident creation to closure. Tracking MTTA separately from MTTR helps identify whether delays originate in acknowledgment or in resolution workflows.
False Alarm Rate
Percentage of total alarms triggered that are false positives. Frequency of nuisance alarms is a useful performance measure. False alarm volume can be high enough to create material operator workload, which is why FAR segmented by alarm type is essential for identifying specific contributors.
Patrol Completion and Report Quality
Patrol completion rate measures the percentage of scheduled checkpoints completed within designated time windows. Guard tour verification systems using NFC tags, QR checkpoints, or GPS tracking can provide more reliable checkpoint documentation. Incident report quality score applies a rubric covering factual completeness, submission timeliness, and clarity. Report quality directly affects evidentiary value for investigations, legal proceedings, and insurance claims.
Incident rate by category and site tracks confirmed security incidents per period, segmented by type and normalized per employee headcount or square footage for cross-site comparison.
Technology and Systems KPIs
A non-functional or degraded camera or an access control failure at a critical point creates a protection gap that staffing changes alone do not solve. The KPIs below track infrastructure reliability at the device and system level.
Camera Uptime and Surveillance Coverage
Camera uptime rate calculates the percentage of time surveillance cameras are functional and recording usable footage during scheduled operational hours. A sub-metric, video quality compliance rate, tracks the percentage of online cameras producing footage meeting defined resolution and clarity requirements.
Coverage rate identifies what percentage of defined security zones fall under active surveillance meeting minimum standards for resolution, angle, and lighting. A high uptime rate paired with low coverage rate indicates placement gaps rather than maintenance failures. These are different problems requiring different budget responses.
Access Control Availability and Credential Hygiene
Access control system availability tracks the percentage of time access control systems are fully operational. Segmenting by critical access points versus general access points reflects the disproportionate risk of failures at high-value locations.
Orphaned credential rate, the percentage of active credentials belonging to separated employees or expired contractors, measures access control effectiveness at the credentialing layer. Uptime metrics miss this dimension entirely.
System Integration Effectiveness
The rate at which integrated systems successfully share data and trigger correct automated cross-system responses without manual intervention. Security teams gain deeper visibility into overall posture when systems share data across platforms. When integration fails, detection and response systems operate in isolation, significantly weakening the benefits of a layered security architecture.
Financial KPIs
Budget owners and executive committees evaluate security programs through financial performance. The KPIs below connect operational outcomes to cost, spend efficiency, and return on investment.
Cost and Spend Metrics
Cost per security incident divides all attributable costs by total incidents over a measurement period. Segmenting by incident type identifies the highest-cost categories for targeted prevention investment. Security spend per square foot normalizes total program expenditure against managed space.
This metric is structurally dangerous when used in isolation because it creates incentives for cost containment at the expense of security performance. Pairing it with effectiveness metrics such as incident rates, response times, and detection probability is a best practice.
ROI and Total Cost of Ownership
Security program ROI estimates the financial value of losses prevented or avoided through security measures, expressed as a ratio to total security investment. Without this metric, security is evaluated only as a cost line rather than a risk management investment.
Technology total cost of ownership captures the full lifecycle cost of security systems, including acquisition, maintenance, and decommissioning. This helps reduce the risk of underbudgeting that point-in-time acquisition cost can create.
Compliance and Regulatory KPI Requirements
Multiple frameworks shape how organizations document, review, and govern physical security controls.
Documenting Measurement Practices
Mature physical security programs define measures of performance and continuous monitoring practices as part of broader control governance. In practice, that means documenting what will be measured, how often it will be reviewed, and who owns remediation when results fall outside target ranges.
Aligning Physical Controls with Governance
Organizations aligning physical security controls with broader governance frameworks often monitor control performance, review results, and document how findings are analyzed and reported. This supports KPI tracking, audits, and incident monitoring against control objectives.
Some organizations still lack specific incident response protocols, making incident response protocol coverage rate a compliance KPI worth auditing directly. Assumed protocol coverage systematically overstates actual coverage.
Program Governance Metrics
Training and certification compliance rate tracks the percentage of security personnel current on required training and certifications at any given point. Incident response protocol coverage rate measures the share of identified threat scenarios with documented, tested response protocols.
Physical security risk assessment currency tracks the percentage of facilities with risk assessments completed within the organization-defined review cycle. Security program evaluation maturity captures whether the organization has moved beyond ad hoc measurement to systematic KPI tracking with defined review cadences and executive reporting.
AI-Enabled KPI Categories for Physical Security
Security teams deploying AI-based video analysis are tracking KPI categories with fewer traditional analogs, measuring pre-incident and behavioral patterns rather than relying exclusively on post-hoc data like incidents reported and response times to confirmed events. In modern deployments, cameras now support continuous analytical monitoring rather than passive recording.
Pre-Incident and Behavioral Metrics
Dwell time detection rate measures the duration an individual remains within a defined zone and the system's capacity to detect anomalous patterns. Traditional operations generally lacked an automated mechanism to measure this systematically; guard observation of loitering was more subjective and not aggregated into trackable rates.
Behavioral anomaly rate measures the frequency of detected behavioral deviations from established baseline patterns per zone or feed, expressed as a continuous rate rather than a discrete alert count.
Proactive intervention rate tracks the percentage of security interventions initiated before an incident is confirmed, based on AI-detected behavioral precursors. This metric typically requires teams to establish their own baseline because traditional systems did not generate pre-incident interventions systematically.
Automation and Override Tracking
Automated response rate and human override rate measure how often AI-triggered automated responses proceed without human authorization, and how often operators subsequently reverse those responses. High override rates may indicate that automated responses are generating outcomes operators frequently need to correct. These two metrics must be tracked jointly.
Crowd density and flow anomaly index quantifies deviations from established pedestrian traffic patterns in monitored zones, flagging counter-flow movement, sudden density spikes, and abnormal evacuation behavior. Pre-incident detection accuracy measures the rate at which AI-flagged behavioral precursors correlate with confirmed security events upon investigation. Both metrics require site-specific baseline calibration.
Threshold Calibration and Standardization Gaps
A single calibration problem affects every AI-enabled KPI category: most machine learning anomaly detection models assign probabilistic scores, and threshold placement determines what gets flagged. Operational baselines should be informed by real deployment data.
Common Pitfalls in KPI Programs
Several recurring failure modes undermine otherwise well-designed KPI programs. The pitfalls below are the most common offenders:
- Reporting raw counts without denominators. This is the most basic measurement failure. A figure of access control alarms in a month carries no interpretive meaning without the total badge transaction volume. A rate per transaction is a metric. The raw count is not.
- Tracking vanity and activity metrics. Measures such as number of cameras installed or guards on shift demonstrate that the program completed activities rather than reduced risk. For every activity metric, security directors should articulate the outcome it is intended to produce, then measure that outcome directly.
- Over-relying on lagging indicators. Incidents, losses, and confirmed breaches describe past failures without revealing current risk trajectory. A facility reporting no incidents in a quarter may reflect genuine effectiveness or a detection gap. Pairing each lagging indicator with a leading indicator enables course correction before results are impacted.
- Presenting raw technical metrics without business translation. Sharing unconverted operational data with non-technical stakeholders actively displaces strategic reasoning. A mean time to detect carries no actionable meaning for an executive unless translated into what an undetected actor can accomplish in that window, and what that represents in financial exposure.
- Selecting metrics that confirm desired outcomes. Surfacing only favorable results rather than uncomfortable gaps is a subtler failure. Security directors who track only metrics where performance looks strong create blind spots that compound over time.
- Defaulting to vendor dashboard metrics. Reporting whatever the installed technology platform generates, rather than defining required measurements first, subordinates the security program's information needs to vendor dashboard defaults.
Structuring Reports for Executive Leadership
Physical security operations metrics are commonly grouped around operational performance, such as detection quality, response speed, operator efficiency, and program accountability. Not all metrics belong in all reports.
Reporting Tiers
Reporting tiers should match audience, cadence, and decision type:
- Operational dashboards serve security operations teams with real-time monitoring, alert management, and the ability to dispatch verified alerts.
- Tactical reports serve security directors with program performance, trend tracking, and resource utilization on a weekly or monthly basis.
- Strategic summaries serve the C-suite and executive leadership with risk posture, financial impact, and compliance status on a quarterly cadence.
Board-level dashboards generally work best with a small set of KPIs; additional metrics can sit in appendices.
The Executive Report Test
Before a metric earns a place in an executive report, it should pass three tests:
- Direction. Does it show whether the organization is safer, more exposed, or unchanged versus the prior period?
- Translation. Can it be expressed in terms of cost, recovered value, avoided loss, or risk exposure without requiring the reader to do the conversion?
- Decision value. Does including it enable a business decision, resource allocation, or risk acceptance?
Metrics that cannot satisfy all three belong in the operational tier.
Maintaining a KPI Program Over Time
A KPI program needs ongoing management to remain useful. New metrics should be piloted on a single workflow, with data reliability confirmed and the measure tested against whether it changes a real decision. If a pilot metric does not drive action, security directors should refine it before applying it across the wider program.
Data definitions change, workflows evolve, and teams sometimes keep reporting a measure after it has stopped guiding decisions. Regular review confirms that each KPI still reflects current risk and operating needs. When no external benchmark exists, internal historical baselines are the strongest starting point. Segmenting results by site, severity, or workflow keeps averages from hiding meaningful differences and aligns targets with local risk conditions.
Retirement criteria matter as much as selection criteria. A KPI should come out of the program when it no longer supports a decision, duplicates a stronger measure, or depends on inconsistent data collection. Removing weak metrics keeps reports shorter and sharpens judgment about program performance.
From Measurement to Decision Advantage
Security directors should audit their current KPI set against this taxonomy, identify which categories lack coverage, and align each tracked metric to a specific decision-maker's question and budget line. Programs that close the gap between operational data and executive decisions secure the resources to improve. The next step is concrete: review each metric in the current program, confirm who acts on it and how, and retire or replace any metric that cannot answer those questions.
Frequently Asked Questions
What is the difference between KPIs and KRIs in physical security, and how should they be used together?
KPIs measure control performance, while KRIs track risk direction over time. Used together, they show whether your security measures are working and whether the threats you face are escalating or declining, enabling proactive adjustment before outcomes degrade.
How do you set appropriate thresholds for AI-enabled physical security metrics like behavioral anomaly rate when there are no industry benchmarks?
Start with a calibration period to establish baseline patterns. Deploy in observation mode, log detected anomalies without triggering responses, then adjust thresholds iteratively based on operator feedback correlating flags to genuine security concerns versus noise.
How should security directors translate technical metrics like mean time to detect into business terms that executives can act on?
Security directors should convert detection intervals into financial exposure calculations by multiplying the time window against asset value at risk, then express findings as potential loss per undetected hour or cost of delayed interdiction rather than raw milliseconds or minutes.
